Microsoft PowerPoint vs Google Slides for business presentation
1. Good possibilities for presentation template set up: layouts, fonts, colours.
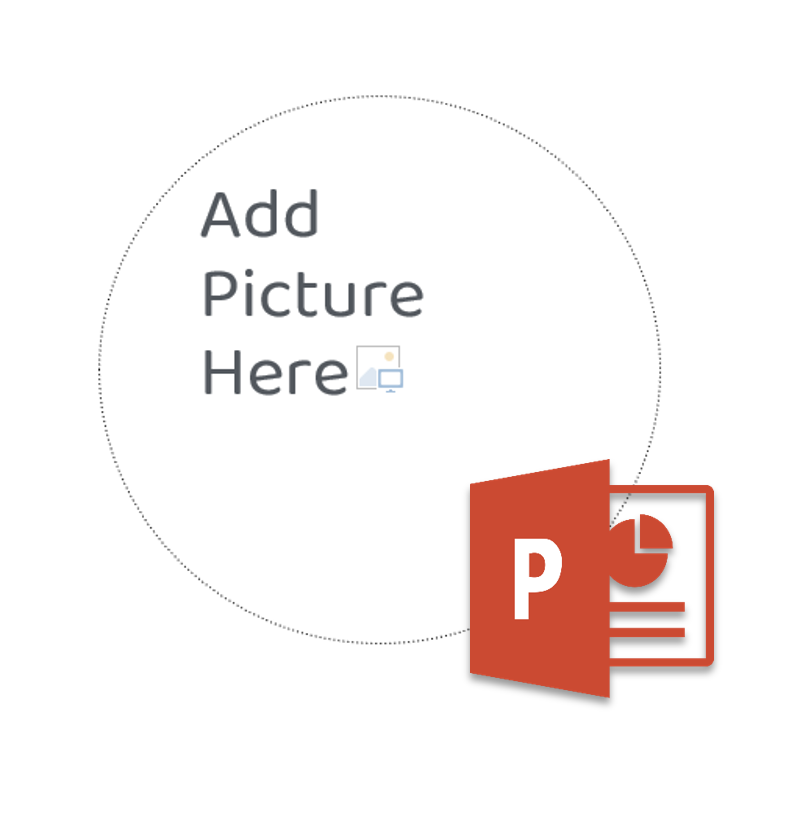
Here I should admit they are both good, PowerPoint a little bit better, but Google Slides now contains everything necessary to create a good template. Even while I was planning this article several possibilities added to the Google Slides. The last one point, which gives some benefits to Powerpoint I might mention here is placeholders for pictures. They exist in PowerPoint, moreover, you can cut them with some figure so your picture will be circle-shaped not just rectangle.
But I use placeholders for picture very rare in real life. It is always possible to paste picture on the slide, and then format it if you need. This option videly used for good-looking templates for sale, and they are not so good in usage as they look.
2. Enough tools for sharing them with team and audience.
A little bit more details: The matter that when I want to share PowerPoint presentation while editing it, I need to use Microsoft PowerPoint online version, and in this version design tools are just a little less comfortable to use than usual, but not crucial. Actually, this point is not about presentation design, but about usability point, but I am sure that you agree with me that business presentation designer should think not only about design, but also about comfortable usage (creating, editing and sharing with team and clients)
3. Guess what is crucial for B2B presentations, full of data info? Of course tables, charts and diagrams.
Business loves to put data as arguments, compare data and visualize it in traditional charts. And it is reasonable as it is the fast way to make strong arguments.
Let’s review this main point for choosing Microsoft PowerPoint vs Google Slides for business presentation.
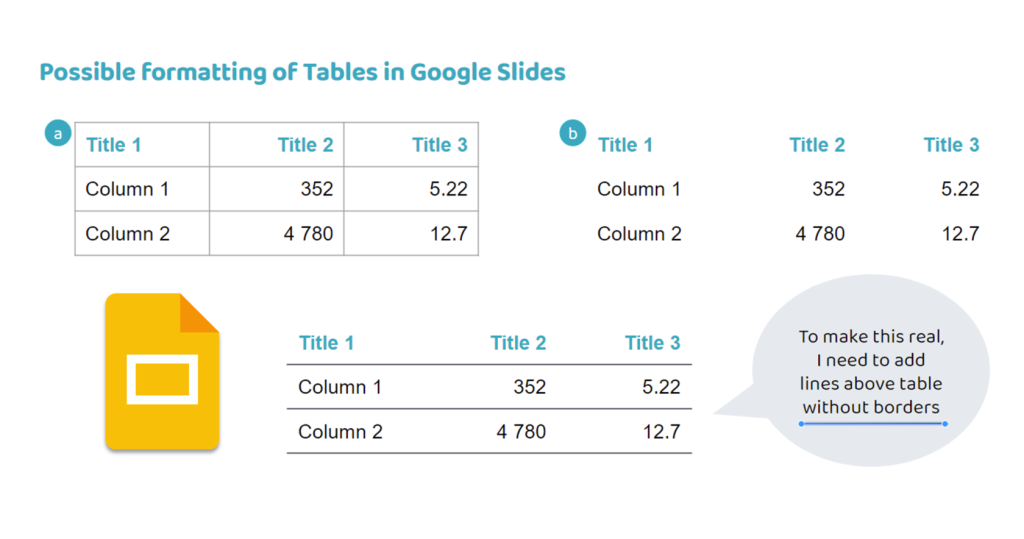
Tables in Google Slides are more or less OK. The main thing that I miss is borders settings. You will not able to make only horysontal borders without vertical, or set thin borders like ½ pt — I use such options to make them elegand and readable, this is one small element of good business presentation design. But I always can use just line above table without borders, not a big deal.
But charts in Google Slides are totally unusable.
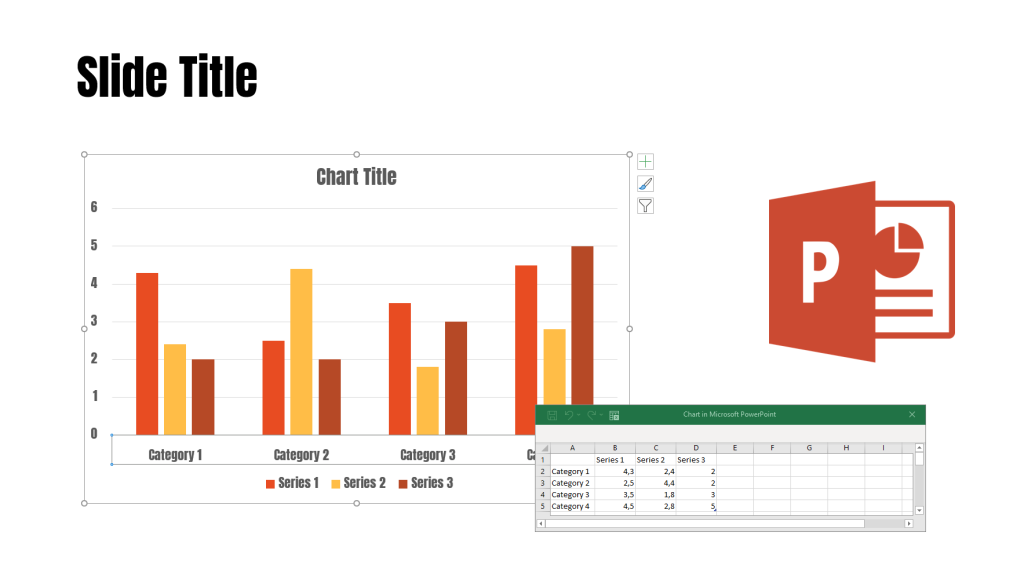
In PowerPoint when I created a new chart it looks like the chart above: it used colours from my colour scheme, fonts from my font scheme and just near it the small window with table is opened and you can easily manage data for chart and see immediately how the chart is changing. Besides, all elements of chart are clickable, and you can easily change the appearance of every element just by clicking on it and changing font, colour, size etc. So you have everything for smart chart design, which is a big part of business presentation design for B2B presentations. And now we were talking for basic chart type. Besides basic types, PowerPoint can propose you to mix types, change various details so great business presentation designer can create a chart, which will look like not from PowerPoint, so this software contains definitely great possibilities for chart design.
Microsoft PowerPoint vs Google Slides for business presentation: Chart formatting in Microsoft PowerPoint
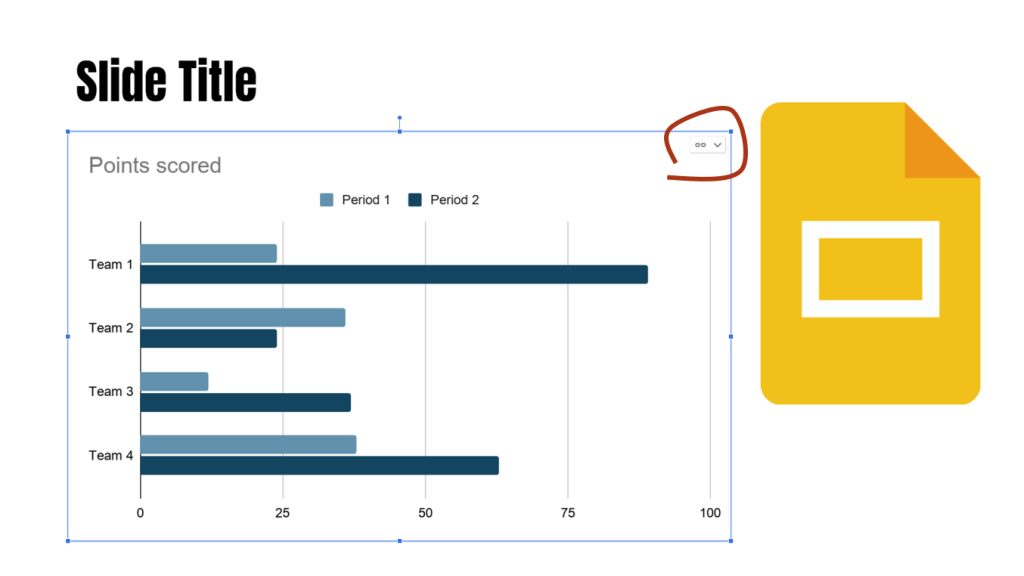
In Google Slides the situation is not so easy. The presentation created, but it is not in a predefined colour scheme, and it doesn’t use predefined fonts. You can compare: fonts and colours are totally different. And what is important, the chart is created with Google Slides but like an embedded element from Google Sheets (when you click on marked chain you will see it). And you can edit it in Google Sheets, clicking on “Open Source”. But the source is opening only in new window. So In Google Slides separate elements of chart is not clickable and changeable.
It means every time you need to open Tables and work there, and it is slow, uncomfortable and totally unpleasant in design term. But maybe inside Google Sheets everything is perfect set up so I do not need to worry at all? Definitely not.
As I wrote the chart does not use my color scheme, but some basic predefined colors cheme with standard font and color. Initially user can’t save color theme there, now it is possible (Thank you Google Slides, you indeed improve a lot every day). But I do not know why to save it, because I save it for one chart, then go to Google Slides, update look of the chart and it indeed appears in new colours, but only this one. As a next step I might want to create a new chart and it will be again in basic color shcme, which is not alike to mine.
And also only basic fonts are available for chart design. So you can use a modern and original font which makes all your presentation beautiful but not your charts. And if you have charts on most slides, so most of your slides will be not beautiful.
Professional business presentation design is not about beauty as it is, it is about consistency, readability and a fast way to work with a lot of slides. Google Slides for now can’t provide it for slides with charts. But probably I need to review this article at least in a half a year, as Google Slides did tremendous progress for last year to increase tools and level of comfort while designing slides and layouts.
Meanwhile, when I should use Google Slides and presentation contains charts I gave up fighting with Google Slides and usually open my PowerPoint, design charts here, export charts as png and past them to Google Slides. For such projects, I have separate Powerpoints with the name “Project A_Charts for Google Slides”.
Charts design is the biggest weak point for B2B presentations full of charts and tables. When Google Slides manage it, I guess the gap will be overcome. But now this is a point to talk and to think while you are choosing Microsoft PowerPoint vs Google Slides for business presentation.
Another 2 less important points I still want to cover to finish this comparison:
4. For B2B presentations it is comfortable to use icons for visualisation.
Icons do not need a lot of space (B2B presentations usually contains a lot of info so it is significant). And usually, you do not need to buy them to have a licence. I have a subscription to the icons service for $ 10 per month and it is totally enough for all my needs.
If I decide to buy photos for visualization for average presentation it would add at least $ 100 to the cost. Creative Commons licenced photos are limited, not about business and not in good condition, you need additionally spent a lot of time in Photoshop to make them better. And normally I work with special terminology which just can’t be illustrated with photos. So PowerPoint for this point made brilliant tool: svg icons are now permittable. I can edit them and convert them to MS Shapes. After that, I recolour all my icons in presentation colour. Write me a message and I will send you a guide, if you want to know how to do it.
Google Slides has not worked with SVG format jet. You need to recolour icons out of Google Slides, using other tools and paste them as png or jpg like it was several years ago in PowerPoint. It is possible but not comfortable and fast and I do not want to turn back.
So this point add a little bit benefit to PowerPoint format for business presentation.
5. I should admit that Google Slides has one feature which I love. Google Slides allows me to use Google fonts and they will be visible for all readers without installing them.
So I can use their big library and be sure that the presentation will appear exactly how I set it up for other people. I love it, because I care about the result. And for now, PowerPoint can’t provide the scheme, which I can use while using creative fonts and be sure that they will be visible for any person, which open ppt file. I will write about it in details later.
Font means a lot for design, but more for design of presentation for show, where 1 slide is a picture and 2−3 words. For business presenation design where every slide contains a lot of various details and elements font choice is still important but not crucial, unfortunately.